blog
highlights of offshore US oil and gas development
and associated facts and figures
Hondo Lane | September 14, 2020
Petrolytics - The American Petroleum Institute (API), in conjunction with OnLocation, Inc, published a report documenting the consequences of a leasing and development ban on US federal lands and waters.
The stated goal of the analysis "is to project the impact that stopping leasing and development on federal lands and offshore would have on oil and gas production, energy prices, the economy, employment and the American consumer through 2030".
The key highlights are as follows:
Energy Security Impacts
- U.S. oil imports from foreign sources could increase by 2 million barrels a day by 2030
- Annual U.S. natural gas exports could decrease by 800 billion cubic feet by 2030
- U.S. offshore natural gas and oil production could decrease by 68% and 44% respectively
Economic Impacts
- U.S. GDP could decline by a cumulative $700 billion by 2030
- Nearly 1 million jobs could be lost by 2022
- U.S. households could spend a cumulative $19 billion more on energy by 2030
- Over $9 billion in government revenue could be at risk
Environmental Impacts
- National U.S. CO2 emissions could increase by an average of 58 million metric tons and keep rising to represent a 5.5% increase in the power sector by 2030
- Current transition from coal to natural gas could be delayed, keeping half the coal capacity that would otherwise be retired by 2030
- Total U.S. coal use could increase by 15% by 2030
The full presentation is available here.
Oil & Gas Weekly Stats
- WTI open: $37.32/bbl
- Brent open: $39.78/bbl
- Natural gas open: $2.31/Mmbtu
- Crude oil refining -1,100 kbopd to 12.8 mmbopd (week of Sept 4)
- US crude oil imports +500 kbopd to 5.4 mmbopd (week of Sept 4)
- US commercial crude inventories +2.0 mmbbl to 500.4 mmbbl (week of Sept 4)
- US active oil rigs -1 to 180
- US active gas rigs -1 to 71
- Int'l active rigs at 747 (Canada at 52)
- US active frac spreads -2 to 85
- BP and Shell Call on Texas to End Routine Flaring
- EIA short-term energy outlook forecast for September
Renewables Weekly Stats
- Cobalt: $14.97/lb
- Copper: $2.89/lb
- Lithium carbonate: $3.29/lb
- Nickel: $6.08/lb
- Solar photovoltaic module: $0.21/peak watt
- Uranium: $31.65/lb
- bp makes first move into offshore wind
- Equinor teams up for offshore wind growth in Japan
Other thoughts
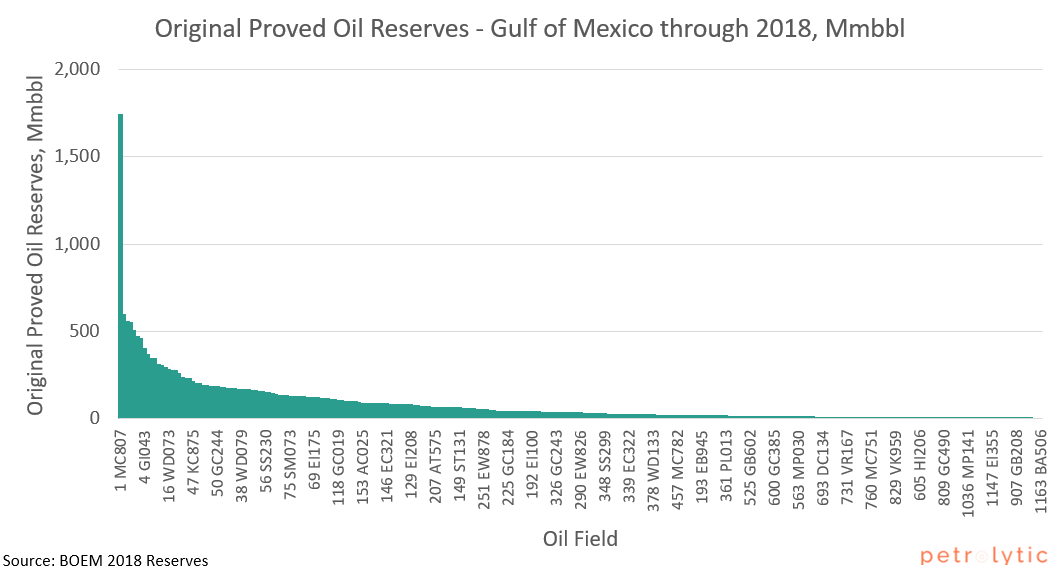
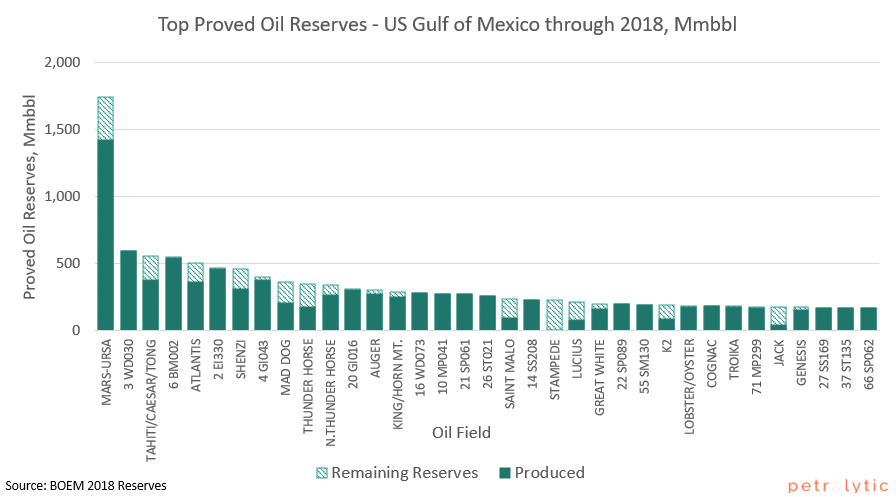
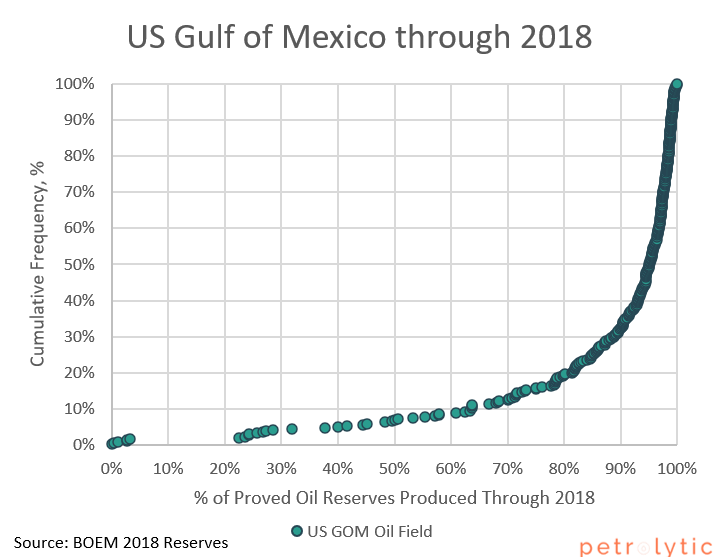
To complement the API report discussed above, we thought we'd wrap up with a few plots illustrating the state of US Gulf of Mexico oil production.


The first plot describes the distribution of developed oil fields in the US Gulf of Mexico. The majority of all proved reserves are held in a small minority of oil fields. More specifically, the 10% of offshore GOM oil fields account for over 80% of total proved reserves in offshore US GOM.
The second plot shows, of the larger oil fields, the fraction of proved reserves that have been produced. While it certainly appears as though the majority of proved reserves have been produced, keep in mind a few caveats:
- These are proved reserves - operators will more than likely revise these figures upward (for the top producing fields) to a number closer to the probable (2P) reserves volumes
- There always exists the possibility of enhanced oil recovery to improve recoverable volumes
- This isn't a recovery factor metric. In-place volumes aren't readily available.
- Proved reserves are impacted by economics. As price improves, these volumes should also improve.
Similarly, the third figure is a cumulative frequency distribution. For example, roughly 50% of offshore US GOM oilfields have produced 95%+ of their proved reserves.
Hope everyone enjoys their week. Follow us on Twitter for daily insights. We'll be back next week with another concise, but comprehensive weekly update.